Sample bar graphs question, report and explanation
This is one question from the Interpreting bar graphs quiz. It shows
- one question from the quiz
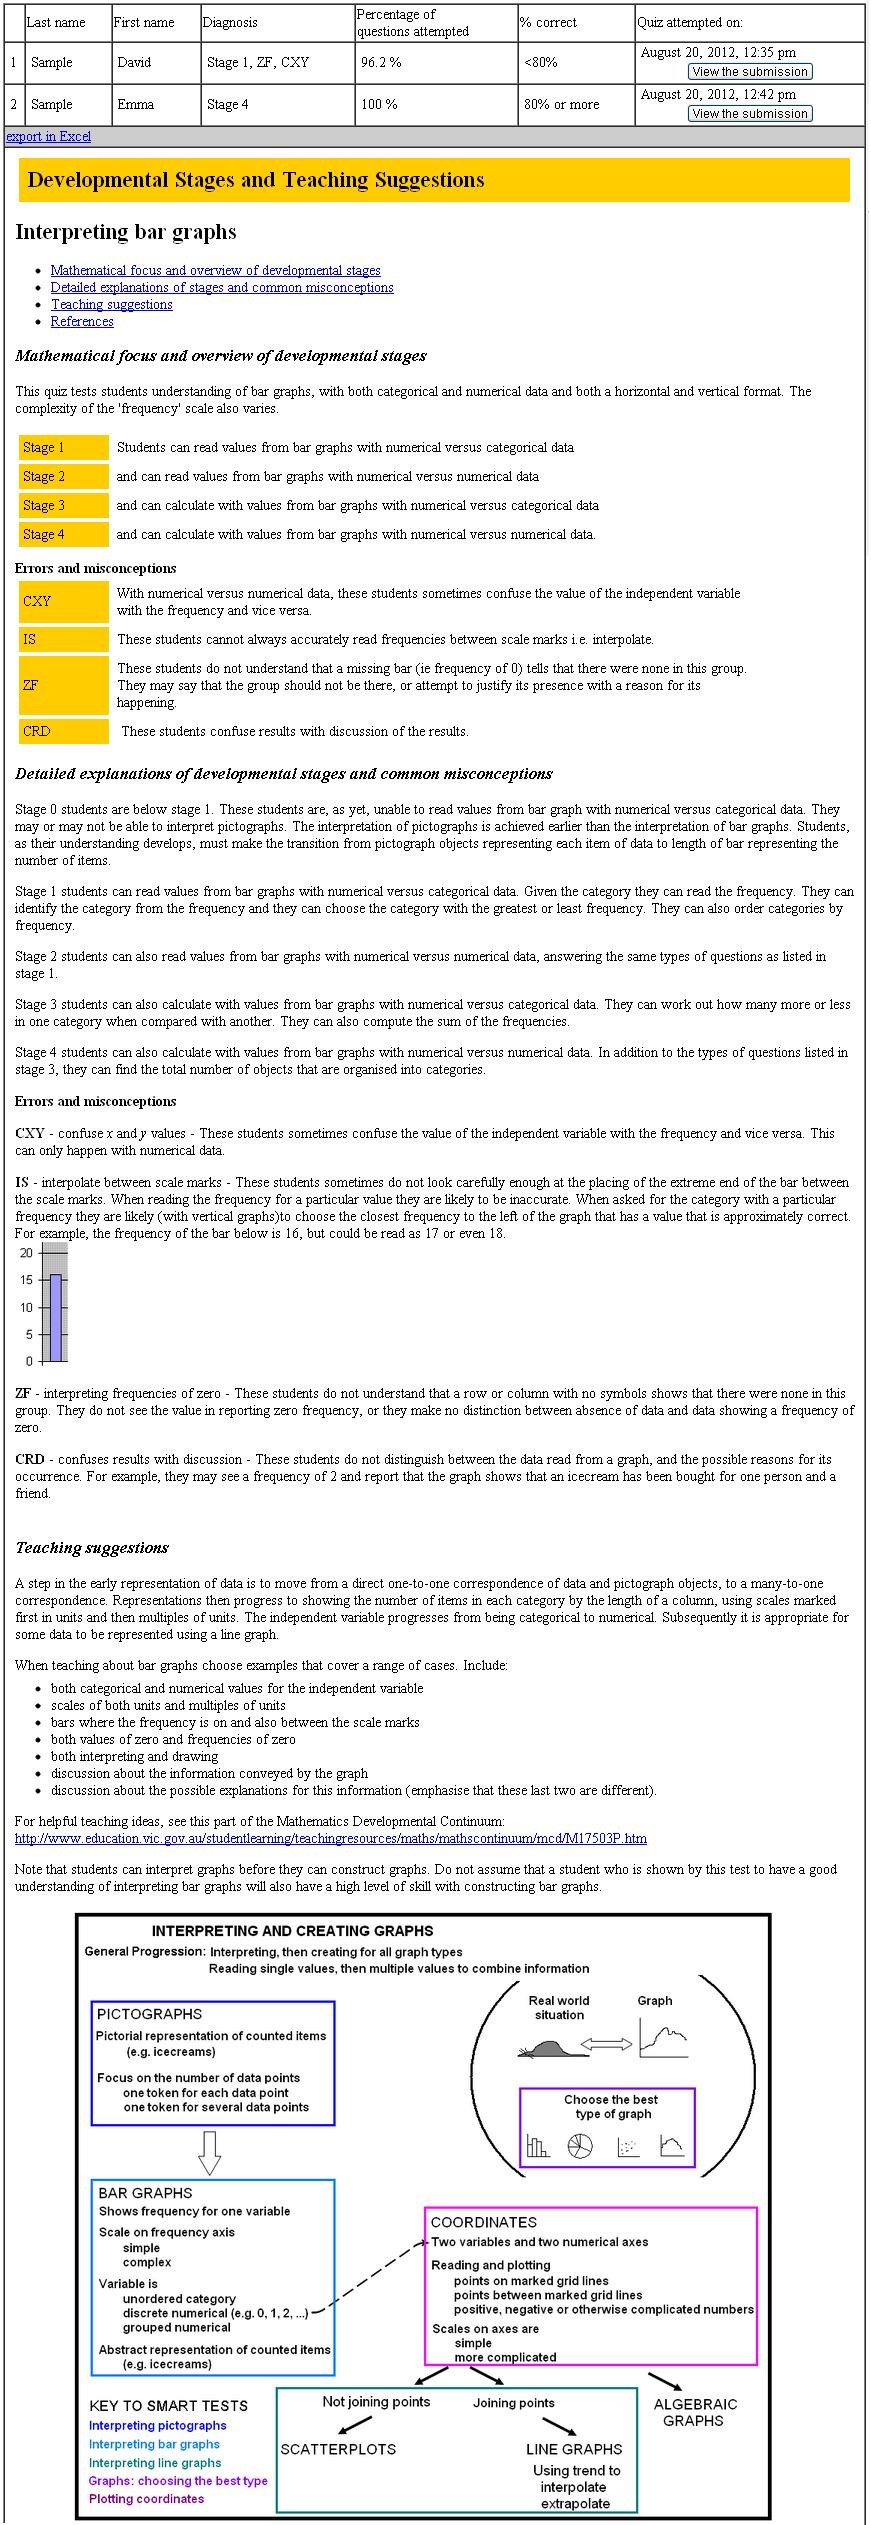
- a sample report on student results for their teacher, followed by the explanation of the report and suggestions for teaching students at each stage.There is a graphic at the end which shows the content focus of all the smart tests on interpreting and creating graphical displays.
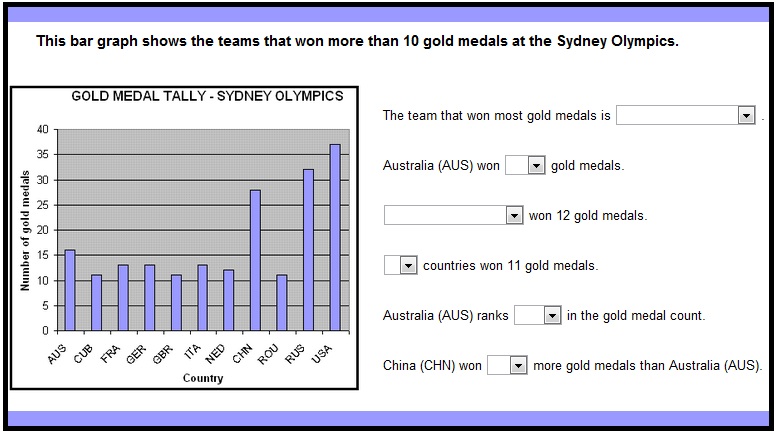
Quiz question from statistics
This item presents a series of questions related to a problem in a real world context. Most smart test items do this. To respond to these questions, students need to select the correct response from a drop-down menu. So, these questions are actually multiple choice.
The response formats for other smart test questions including typing simple responses, using sliders, positioning images, and multiple choice. Like these questions, the questions are usually quick to answer and do not require much working out.
Sample report, explanation and diagnoses
Results for each student are available as soon as the student finishes. Results for all students using the given password are presented in a table. The table gives the diagnosis for the student (see below), the date and time, a link to see the students actual answers (depending on your log in status) and two pieces of data to help understand unexpectedly low results (the percentage of questions attempted and whether the student got most of the questions correct). For more information on this aspect, see 'Analysing the results'.
There is a button to download the results into a spreadsheet so that they can be easily sorted. Some teachers get students to include a code for class in their names, to enable easy sorting by class.
Accompanying the results is information about developmental stages, and also the teaching suggestions. Each page begins with an outline of the mathematical focus of the test. The developmental stages (see 'Using smart tests') are then described, first in summary form and also in more detail for first time users. The tests also report common errors and misconceptions, triggered when a studen has made the same error, systematically across questions. A systematic error is properly called a misconception when it has a conceptual basis, that reveals deep misunderstanding.
The teaching suggestions are usually organised by developmental stage. They are brief, but hopefully will provide some ideas which get at the heart of what students need to master to move onto the next stage.
Finally, this sample ends with a graphic which shows how the several tests on graphing are related.
Results of two students, followed by explanations of stages and teaching suggestions
Back to "Try smart tests"