Using the smart diagnosis to teach for conceptual growth
|
Teaching for conceptual growth
Many students have misconceptions or gaps in their knowledge which are a barrier for further learning but often go unaddressed. The smart tests aim to give teachers readily useable information to help bring about specific conceptual changes. This page provides some information about teaching that can help bring about this growth.
Charles Dicken's book "Hard Times" (1854, retrieved from: http://www.pagebypagebooks.com/)
has a character named Sissy, who shares the distress that students
feel when they make mistakes and demonstrate their misunderstandings.
'You don't know,' said Sissy, half crying, 'what a stupid
girl I am. All through school hours I make mistakes. Mr. and Mrs.
McChoakumchild call me up, over and over again, regularly to make
mistakes. I can't help them. They seem to come natural to me.'
On the other hand, there is a substantial body of research that
shows the importance to students' progress of addressing their misconceptions
and missing conceptions. Many students are held back because they
carry incorrect ideas about underlying concepts which they can cover
over, or because they are are missing fundamental building blocks
of knowledge. A teacher can provide instruction which
uses professional knowledge about students' limited or wrong ideas in a productive way without
making them feel like Sissy.
Steps in teaching for conceptual growth
Step 1 - Ensure you have a clear idea of the key conceptual
points of the topic, and how the topic is linked to other topics. Conceptual learning is characterised by strong
connections with other parts of mathematics and with the uses of mathematical ideas in the real world.
The teaching strategies provided with the smart test diagnosis sometimes also provide graphic outlines of the way topics are linked.
Step 2 - Ensure you have a general knowledge of students'
thinking about the topic, including the stages of learning and the main misconceptions (the
smart diagnosis can provide information about this)
Step 3 - Get specific knowledge of how your own students
think about the topic (smart tests provide this information)
Step 4 - Design lessons that;
- focus on the key points that your students need, recognising that different students may have different needs
- provide challenging tasks which hit the 'sweet-spot' for difficulty - hard enough to learn from, but not too hard to engage with
- provoke cognitive conflict by exposing misconceptions - this can often be done well with group work
- resolve cognitive conflict eg through teacher-led discussion and demonstration
- consolidate new learning
- follow up some time later to see if students retain what has been learned. The smart test pairs can be used as pre-test and post-test for this purpose.
The teaching strategies provided under the smart test diagnosis can help with identifying the key points for teaching students at each of the different stages. The teaching strategies also provide links to some on-line resources such as the Mathematics Developmental Continuum. Of course many excellent mathematics resources are not on-line.

Diagnosis of Developmental stages, misconceptions, and common errors
Smart tests provide diagnostic information to teachers. The result for each student consists of a stage of learning and a list of misconceptions and common errors. This is the main information. Two additional pieces of information (percent of questions attempted and whether student scored highly) are provided to help interpret unusual results.
The results are not reported as a "percent correct'. Instead the very complex programming which operates automatically when the student submits their test responses looks in detail at each answer, to see what concepts have been mastered and whether there are any patterns in the wrong answers that the student has given. The items in the smart test have been carefully designed to make this possible. Note that the percent correct does not reliably indicate a student's stage, because it depends which questions the student has answered correctly and what their actual responses are.
What are developmental stages?
Almost all SMART tests report student understanding using developmental stages. The understanding of students in many maths topics ranges from none, to basic, to more complex, then to complete.
- If a student makes errors on the most basic items, his or her understanding will be reported as Stage 0. This will occur even if some more complex items are correct. It will alert a teacher to a basic concept that is not understood.
- If a student makes errors only on more complex items, his or her understanding will be reported as a mid-ranking stage.
- For a student's understanding to be reported as a high stage, that student will have demonstrated understanding of all of the lower ranking concepts as well as those of the high stage.
The stages are specific to each test (or pair of parallel tests). A good student might be at Stage 3 (out of 4 stages) on Test ABC for example and at Stage 1 (out of 3 stages) on Test DEF. Maybe the student really is 'better' at the content tested by Test ABC, or maybe the content of Test DEF is harder or has not been taught. The stages in the two tests do not align.
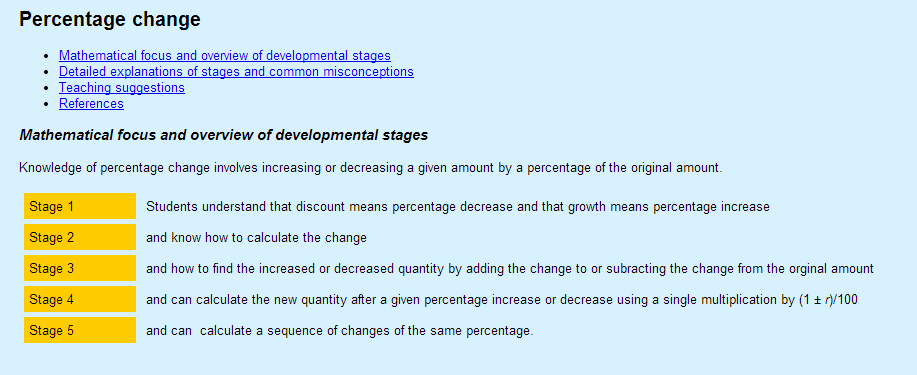
The image below shows a summary of the developmental stages for one smart test. Further details on each stage are given in the teachers' notes.
What are misconceptions, errors and gaps in understanding?
When the smart test programming identifies an educationally significant pattern in a student's answers, this is reported as a 'common error, misconception or gap in understanding'. Both correct and incorrect answers are taken into account when the programming looks for these patterns.
The smart test diagnosis lists the common errors and misconceptions that are identified for each students.
Misconceptions are errors that are caused by having a faulty concept - a fundamentally wrong understanding about a mathematical object or property. Misconceptions generally result in systematic errors - the same error will underly many of the student's answers. For example, a student may believe that the sign = is just something that indicates where to put an answer to a 'sum' (rather than indicating that expressions on both sides have the same value). This student will answer 5+ 7 = ? correctly, but will answer 5 + 7 = ? + 3 incorrectly (giving 12 or perhaps 15, rather than the correct answer 9).
We also report some common errors which frequently occur, but do not seem to be due to a misconception. For example, even students who are well aware of the distributive law may occasionally forget to multiply the last term in the bracket (e.g. writing 3a (2b +c + 1) = 6ab + 3ac + 1). This error is often due to lapse of concentration.
Occasionally we also report gaps in knowledge - facts required by the smart test that the student does not yet know. For example, a student may not know that a millilitre is a cubic centimetre. As far as possible, the questions avoid any factual knowledge that is not mainstream.
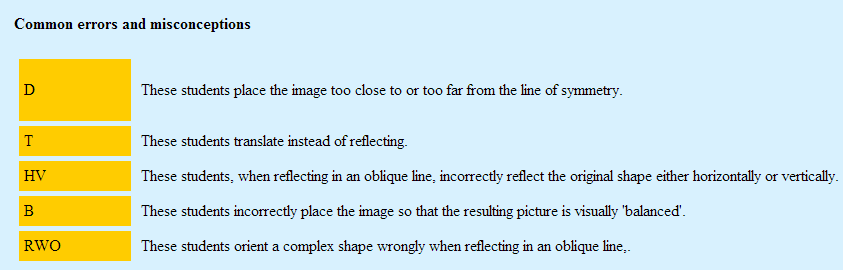
Here is a sample of the common errors and misconceptions reported for the smart test on geometric reflections. The student report uses the abbreviations on the right hand side.
Analysing the results
Teachers can read the results on the screen, or download to a spreadsheet so that students can easily be grouped according to the stage of learning, or shared misconceptions and errors. This is also useful to quickly compare results from a pre-test and post-test.
The two columns 'percent correct' and 'percent attempted' are useful for understanding unexpected results, such as a good student who may have performed badly. If students have not attempted most of the questions, then the diagnosis is not reliable. Ask these students to repeat the test. Check first that they know about pressing the 'submit' button.
If the usually strong student has attempted most of the questions and has a low stage, the diagnosis is worth checking because even very capable students do sometimes have gaps in their understanding. Sometimes good procedural skills can disguise a lack of fundamental understanding. Ask the student to explain to you his or her thinking on some of the easier questions to check the validity of the report.
The 'percent correct' column tells the teacher if the student got over 80% of the questions right, or not. This rough indicator can be used to help identify students who have made 'careless' errors which have prevented them crossing the hurdles of the early stages. However, in our experience, it is often worthwhile for the teacher to investigate with a short student interview.
Note: Right now we are trialling a feature that enables you to see student answers. For smart test users with certain log in permissions, the results table on the teacher page has a button labelled “View the submission”. Often this will make it easier to see the sorts of errors made by students. Please note that we are still seeking to solve difficulties with viewing some slider questions. While the slider may not be exactly as placed by the student, the numerical answer beside will show the student response.
Note that stages are assigned on the basis of all the student responses. Multiple careless errors or omissions will interfere with a reliable diagnosis. However incorrect answers and consequently unexpectedly low stages are most often the result of faulty thinking than the result of careless errors.
Here is a sample of results for the factors and multiples smart test

Using the results in teaching
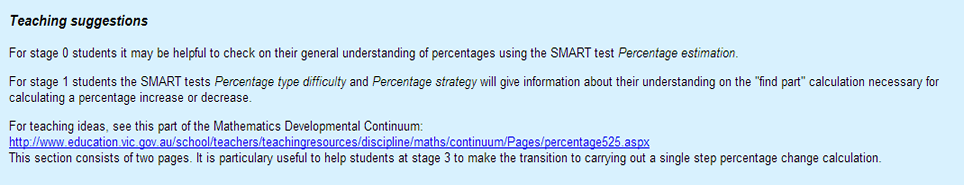
The descriptions of the stages (given below the results of the students) indicate in general terms what students now understand, and by looking at the next stage, what learning is likely to come next. There are teaching suggestions with each test, that often suggest teaching specifically for each of the stages. As the smart tests are further developed and more online teaching resources become available, we expect the teaching suggestions for students at each stage to grow.
As noted above, smart test diagnoses will enable you to target remedial teaching where it is needed. They can identify students whose understanding is already good, who can move on to something else. They can show you the range of different item types that your teaching should include. In most aspects of learning maths, there are central ideas which have to be applied in increasingly complex ways, which all need to be taught and assessed.
Here is a sample of teaching suggestions for the percentage change smart test. Most other suggestions are more extensive.